TOOL1 – Procedure to download weather forecast from an external web service
This tool downloads four times in a day the updated weather forecast for the area of the pilot. Information (provided by an external commercial service) are available for a dataset of one hundred points and the weather forecast horizon is 72 hours.
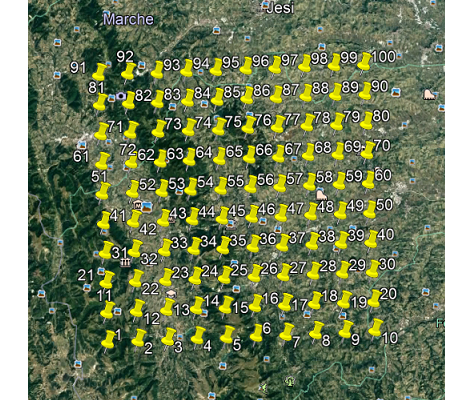
Area covered by the weather forecast 
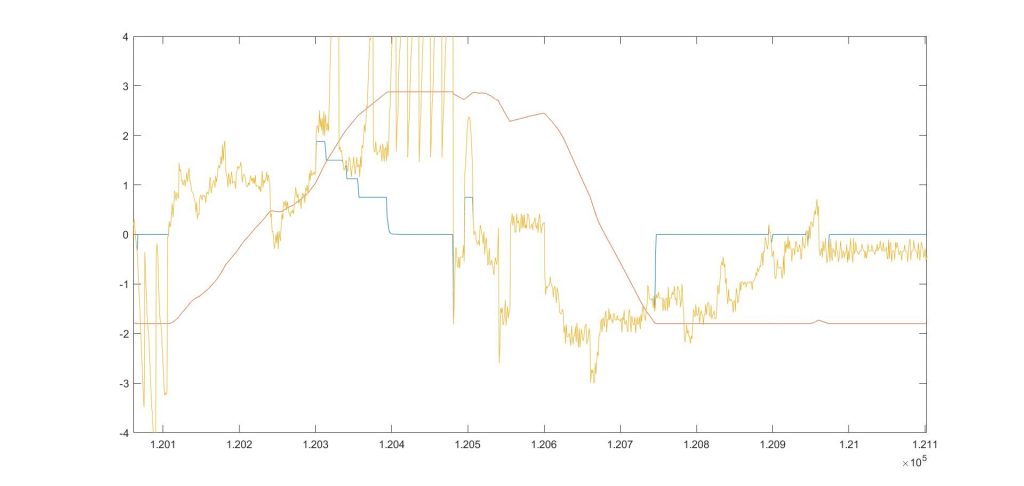
Example of weather forecast graphical representation
TOOL2 – Optimization of the Grid Topology
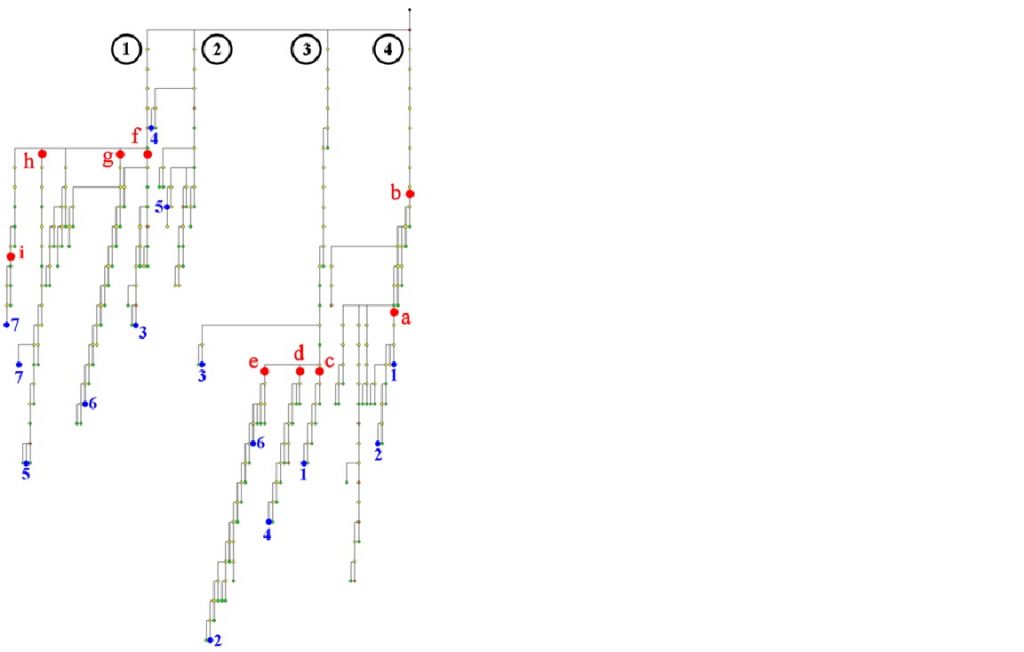
Time series approaches and weather forecast data(provided in output by TOOL1) are adopted in order to predict renewables production and load consumption. A metering infrastructure deployed in the MV grid will provide data to the ASSEM control Centre thanks to a TLC network, realized by mobile network (GSM/LTE), Wi-Fi and Fibre Optic (FO) technologies. Data are processed by the MV Distribution Networks Management Tools in order to identify the optimal topology of the MV grid in terms of losses or other operational indicators (Quality of Service, Hosting Capacity, etc.).
In particular ... This tool is based on the following steps:
– Historical data and time series analysis are used to syntetize yearly profile for each DG power plant and for user’s consumption.
– Weather forecast obtained with tool 1 are used to forecast the power production for the DG power plants for the next 72 hours.
– Data gathering from DSO SCADA
– Optimization of the Grid Topology
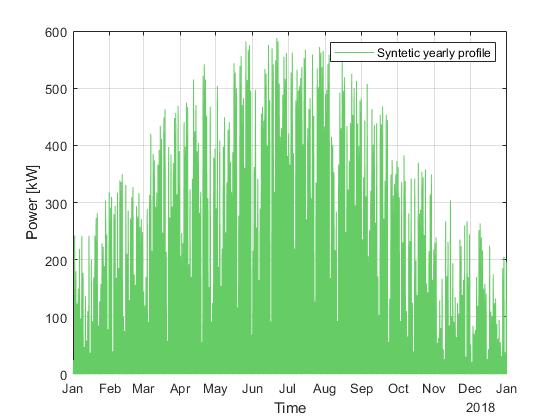
Sintetic year of power production from a PV power plant 
Rolling horizon for the forecast procedure on a PV power plant
Given the status of the grid and the forecast of the Injections (both for loads and generators) the developed algorithm evaluates the topology of the MV grid and identify the set of configurations considered admissible from a merely topological point of view: i.e. grid’s configurations allowing all users to be supplied by the main grid (absence of electric islands) and not showing electrical loops (in accordance with the hypothesis of network managed as a radial system). Then, the method evaluates by power flow calculations, for each network configuration considered admissible, the relevant energy losses occurring on network’s conductors and transformers. Finally, the optimal solution is selected as the configuration able to ensure on the period under analysis the lowest energy losses .
TOOL3 – Description
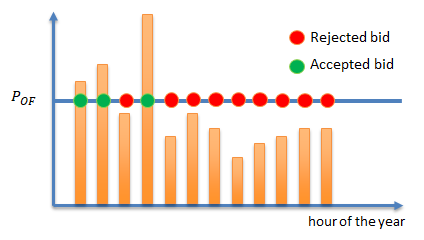
Another tool is devoted to simulate the Italian Ancillary Market and to consequently schedule the BESSs.
Actually, it computes the power set-point for the BESS, considering the conditions of the storage in terms of state of charge, the needs for local self-consumption and the requirements for ancillary services provision from the electricity grid. In particular, it determines the strategy to be followed on the ancillary services market in terms of prices and quantities to be offered, considering historical market data and availability of storage capacity.